Data base
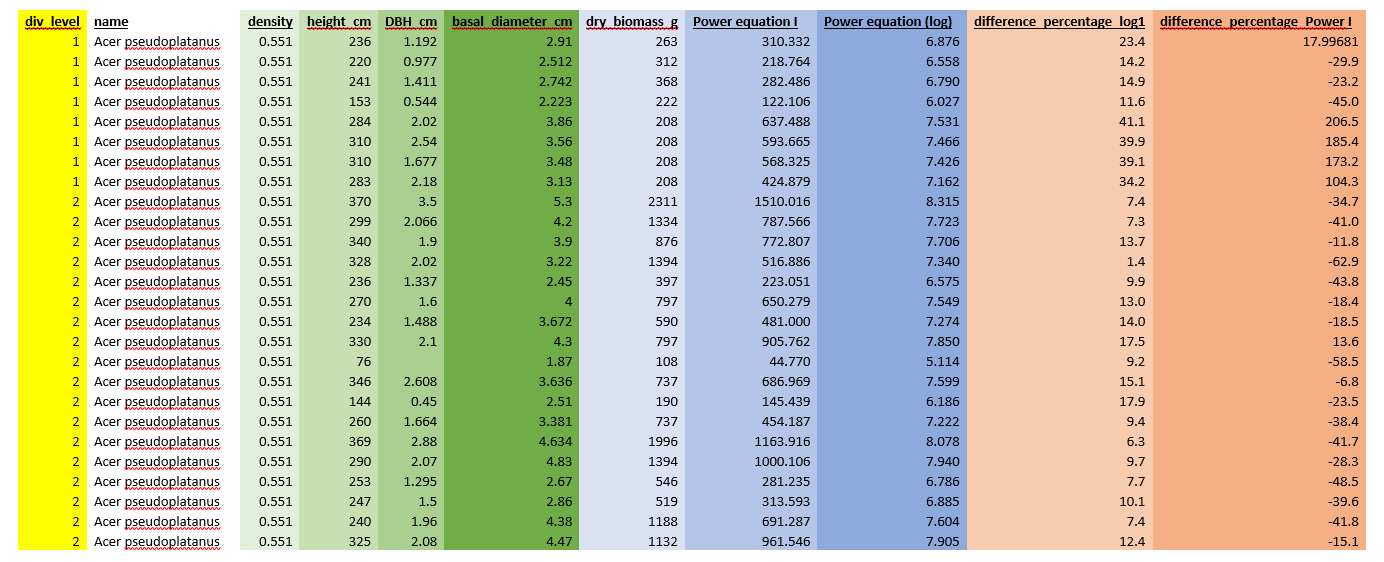
The original data table is way bigger. The table above only shows the species Acer pseudoplatanus, which is a common tree variety of maples in Europe. Raw data is shown in green and yellow. It contains the diversity level, "1" for monoculture and "2" for mixture, the average density, height, DBH (diameter at breast height) and RCD (root collar diameter). Blue columns represent the real biomass, which was measured, and the estimated biomasses of two power equations. An important main stray for the studies are the differences between real biomass and the predicted ones, shown in red. Those analytic columns are an example for how the results may look like. I will primarily work with the comparison of estimated biomasses calculated with species specific and general equations and the average biomasses to check for over yielding effects.
Every tree is a sampling unit for itself. Species form a unit as well as the different diversity levels and the whole experiment. The experiment data is not manipulated, simply observed. I simply changed the unit from mm to cm. As predictor variables serve DBH, Height and density (green). Response variables are all biomasses, predicted ones and measured ones. We have no continuous variable. The data was only once observed.
Every tree is a sampling unit for itself. Species form a unit as well as the different diversity levels and the whole experiment. The experiment data is not manipulated, simply observed. I simply changed the unit from mm to cm. As predictor variables serve DBH, Height and density (green). Response variables are all biomasses, predicted ones and measured ones. We have no continuous variable. The data was only once observed.
Data Management is important!
The fixed version looks fine to go on with. A chestnut outlier appeared. Because it is to small for its DBH, it was decided to delete this individual, so that the results are not falsified by an outlier.
|
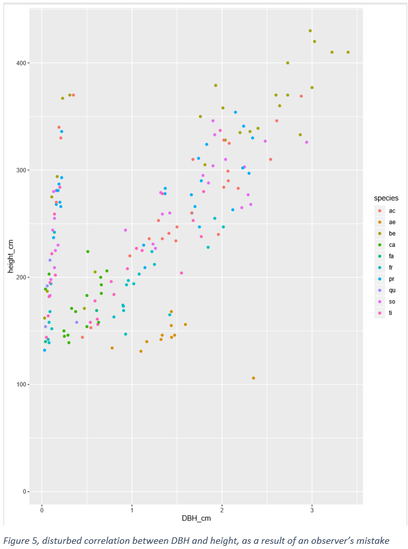
The simple plotting of the raw data showed that the relationship between DBH and Height was disturbed. You would expect a linear distribution because height is a function of DBH and vice versa. It seems like the data consist of regular sized trees and trees, which have a regular height but a very small diameter. After a two day expedition to find the mistake, the observers gave the key indication. The answer to the question was a simple one in the end: The observers changed during field work. The first observer used the unit mm for DBH, the second observer used cm. In order to remedy this error, from tree 193 all diameters were multiplied with ten. 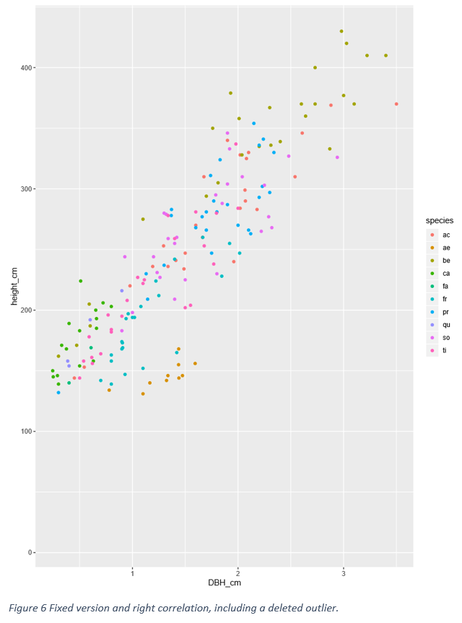
|
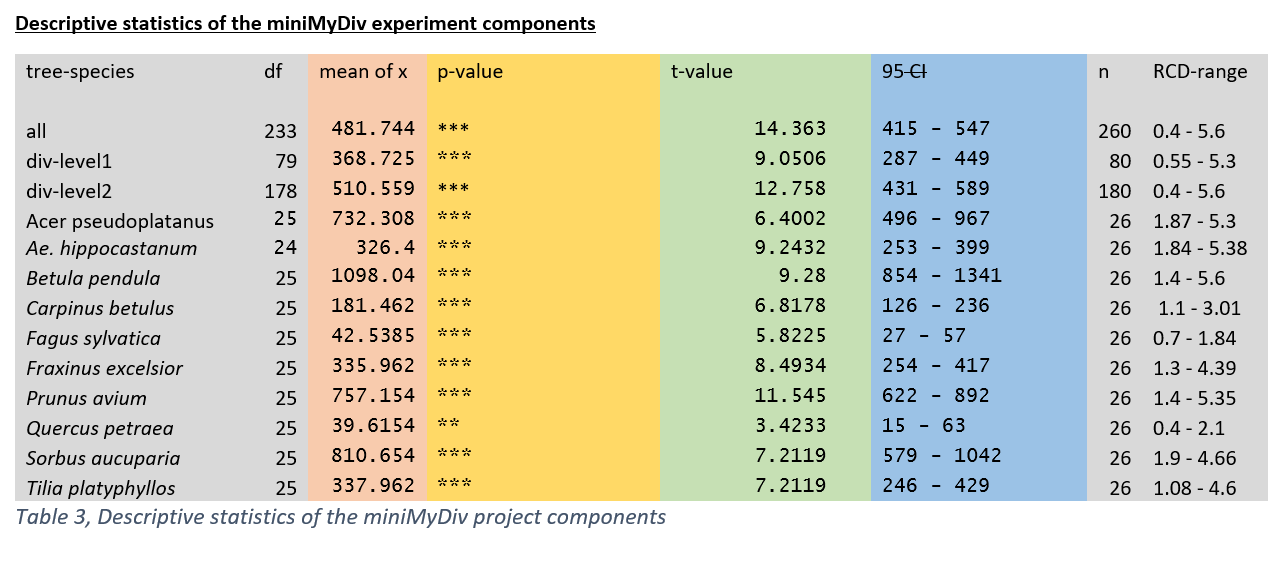
As you can see below, the data basis can be characterized by a high heterogeneity. Its nature can be useful, related to the key questions of this research. The biomasses of the several species differ a lot, partially. Obviously, a mixture of oak and birch - two sorts of trees that vary regarding the growth rate during juvenile stages - will overestimate the biomass of birch and underestimate the biomass of oak in total. With this realization in mind, one target of this ongoing research must be specifying the influences of mixture effects particularly.
The statistics of data also show a lack of observations. The validity of the scientific findings depends on the robustness of the applied data. The old sentence "caveat emptor" makes it necessary to point out that the data basis is low. Therefore it might be advisable to prove the results with other datasets of juvenile stands.
The statistics of data also show a lack of observations. The validity of the scientific findings depends on the robustness of the applied data. The old sentence "caveat emptor" makes it necessary to point out that the data basis is low. Therefore it might be advisable to prove the results with other datasets of juvenile stands.
Correlations
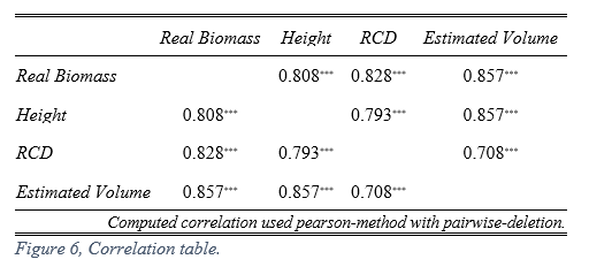
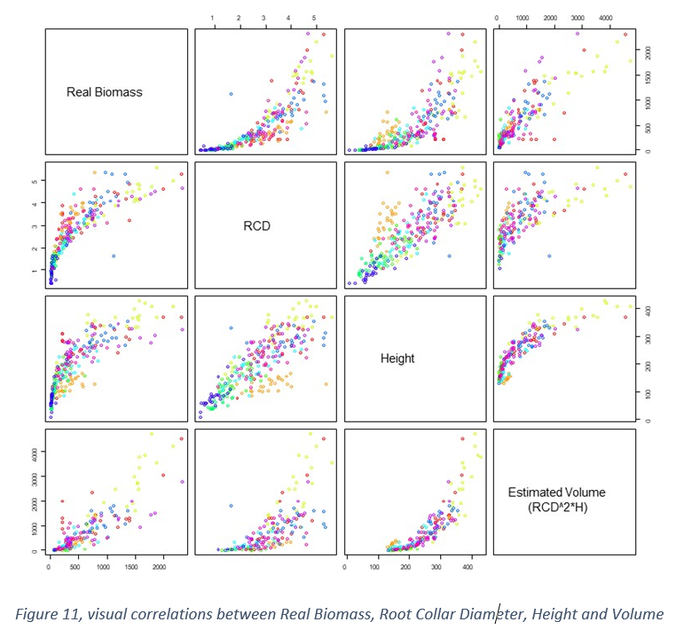
Correlations between Height, RCD, volume and biomass are an important fundament for this research. Reliable biomass equations are based in the fact, that all parameters are correlated to each other. In theory, it is possible to predict one parameter from the other. The table shows this phenomena with a significant correlations for each parameter.
|
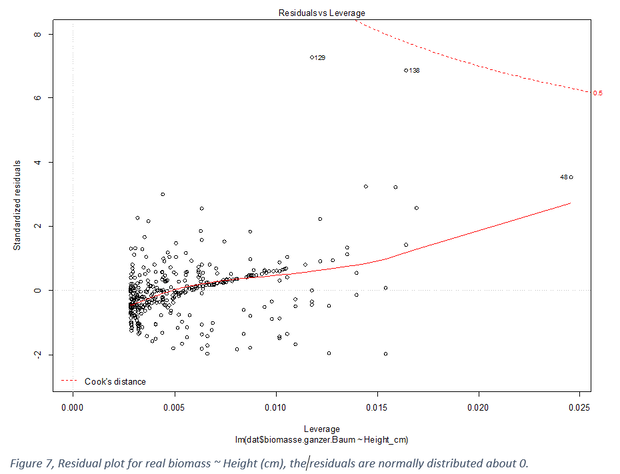
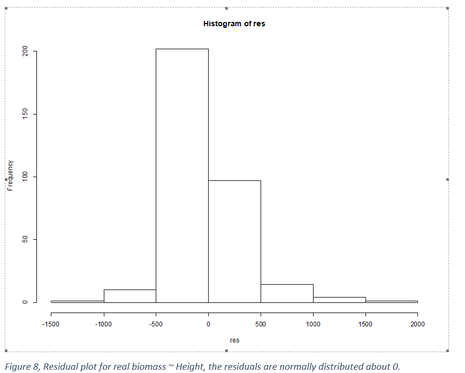
The plots below and on the left visualize the steadiness of the residuals, as well as of the correlation between the measured biomass and the measured height
(white background). |
|
|
|
|
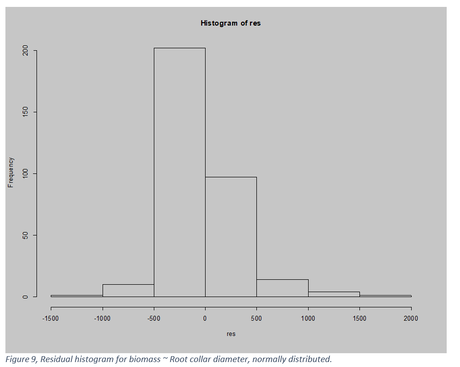
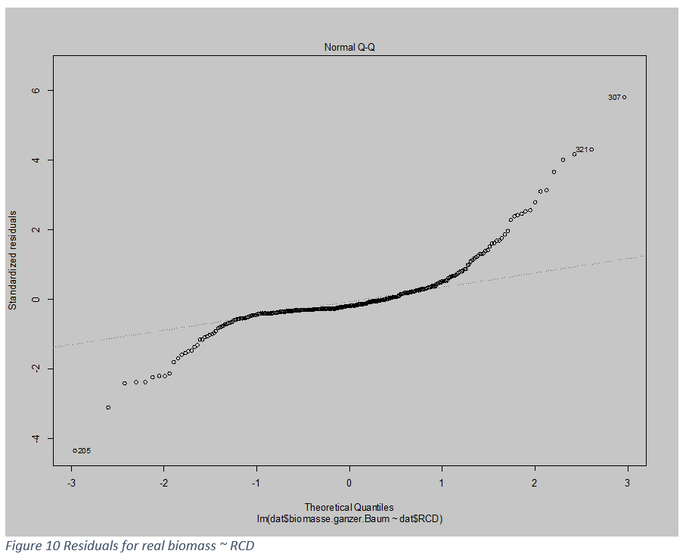
The plots above on the right side and on the left analyze the correlation and the residuals between measured biomass and Root collar diameter(grey background). RCD Measurements are easy to handle. The best practical solution for biomass prediction would only be based on RCD.
Figure 11 visualizes the correlation as dotplots. |